Attribution : Returning User
User engagement metrics over a specific period
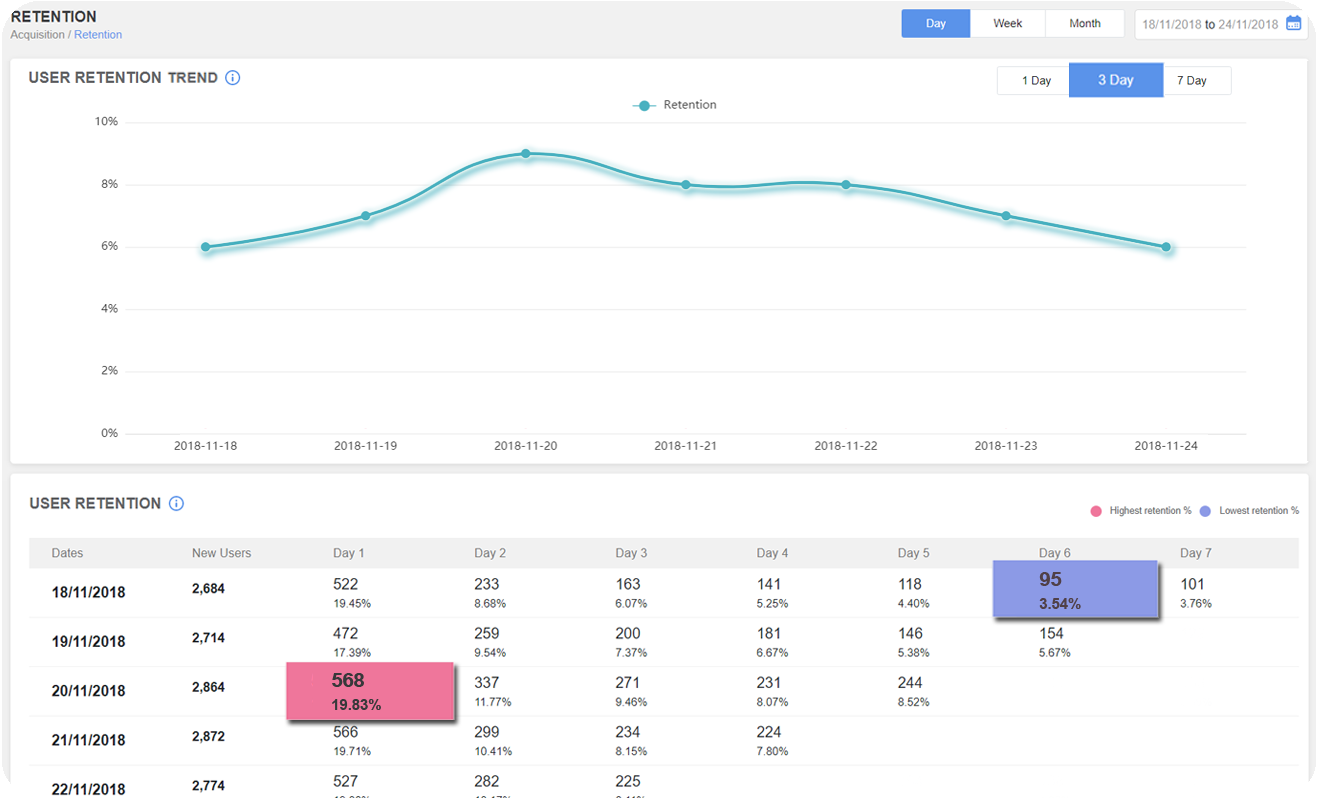
Retaining the users who have launched your app. Retention is one of the important metrics that an app marketer needs to consider because it defines the effectiveness and user engagement with an app. With AdGyde, you would be easily able to know the number of users that you have, users who returned on the next day and subsequent days. This feature also helps in analysing the user retention on a regular basis where he can see the retention rates in different time frames such as daily, weekly and monthly.
AdGyde provides a more detailed view of Retention analysis showing the users who installed the app in a defined time frame and how many of them have retained. Thus, to know the success of the app is termed as Retention, also it means keeping users engaged within it to have a better mobile measurement.
A higher retention rate is always better because the users who stay active for a prolonged period leads to more engagement including a bigger monetization chance. Potential insights are provided into the app’s longevity letting you know about the user’s activity on an app. Therefore, you would be able to know:
- How many new users, do you have?
- How many users returned the next day?
- How much is the frequency of the sessions?
- How much is the average time between each session?
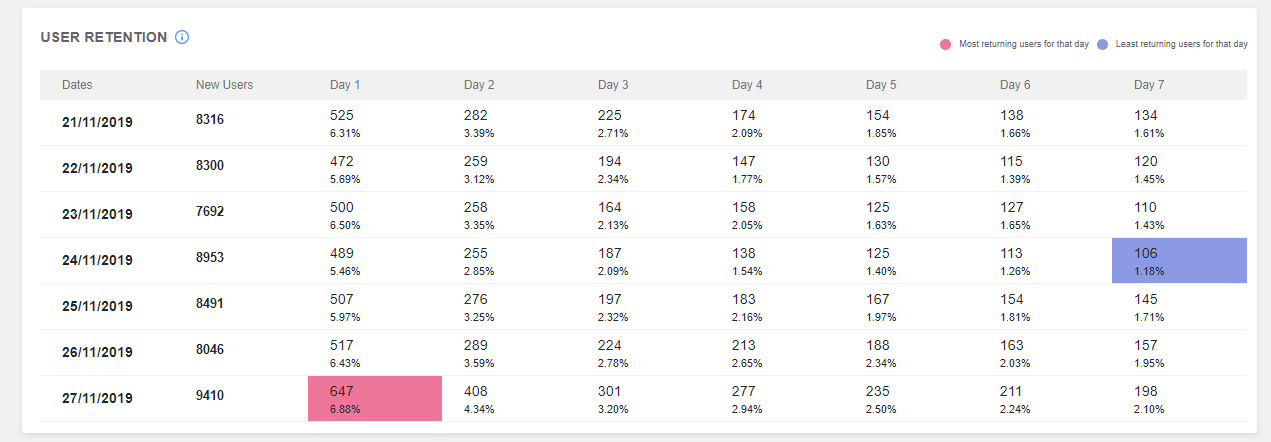
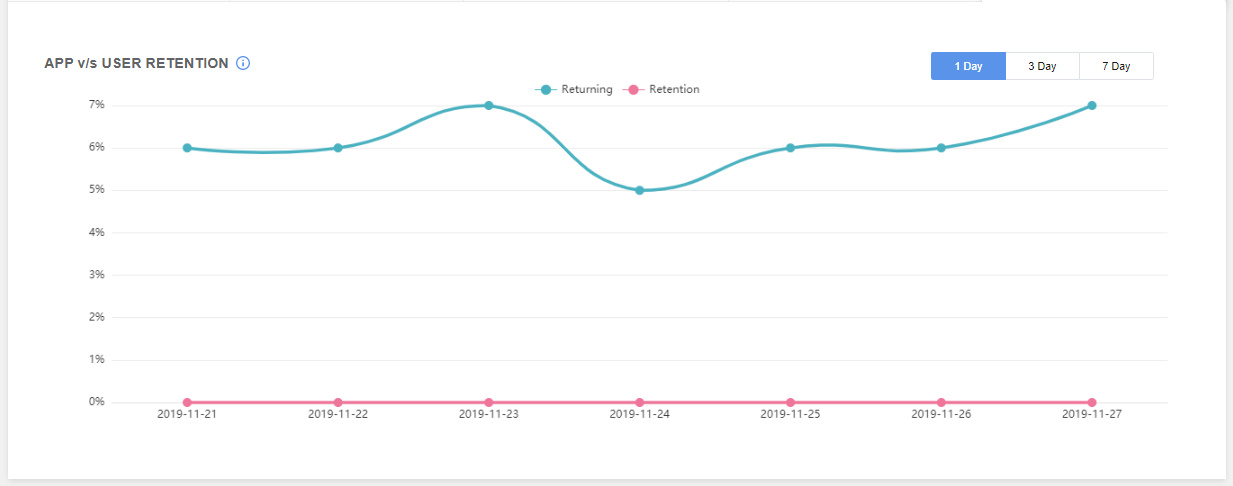
Returning User
Retention metrics define the remaining users on an app on subsequent days whereas, Returning Users show channel wise new users being acquired on a particular day along with the number of users that not only retain your app but also launch your app on subsequent days. A user on d0 would be a new user but on d1, when the user interacts with the app would be called the Returning User.
Let’s understand the concept of Retention with an example.
For Example, the Total number of users are 500
Number of users who have uninstalled the app on d1 are 100
Therefore, Retention = Total Number of users – Number of users who have uninstalled the app on d1
Retention = 500 – 100 = 400
So, d1 retention is 400
Example of Returning User:
| New User | d0 | d1 | d2 | d3 |
|---|---|---|---|---|
| Returning User | 500 | 350 | 300 | 400 |
Here,
Returning User on d1 is 350, d2 is 300 and d3 is 400.
Returning User is calculated every day as per New Users on d0 i.e. users who are active today out of the new users acquired on d0.
Rolling Retention
Rolling Retention tells the number of users returning on a daily basis. So, every day the user count is calculated from the users who came yesterday i.e. on d0 a total of 350 New Users were acquired, on d1 out of these 350 users, 300 were active. Out of these 300 who came on d1, 250 users came back and were active on d2. Similarly, on d3 users should be the ones who were Active on d2.